desert dust
modelling emissions and transport of desert dust
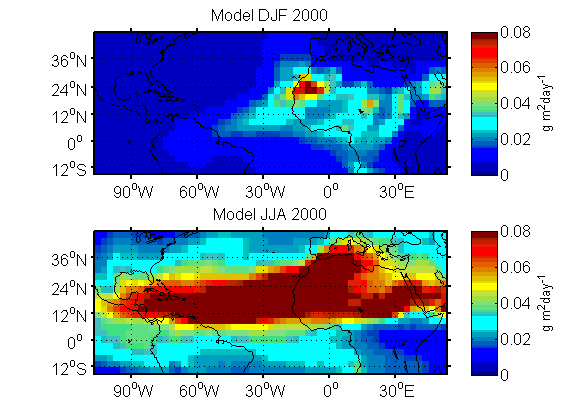
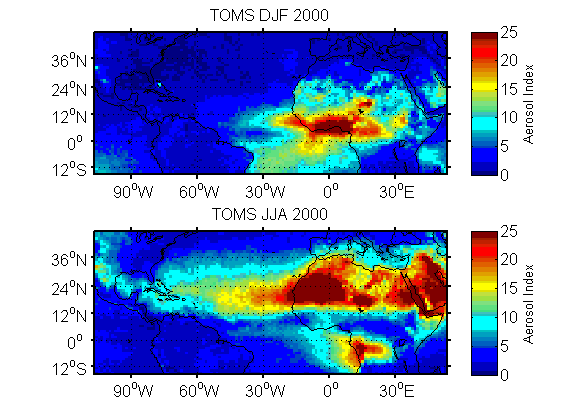
Desert dust concentrations measured at Barbados where four times higher in the 1980s relative to the 1960s. My PhD sought to understand why. By developing a dust cycle model, I showed there was an expansion of the Sahara in 1980s relative to 1960s resulting in a doubling of emissions from the Sahel. This alone was not enough to account for the high dust concentrations observed at Barbados. The results added strength to the hypothesis that human induced soil degradation in North Africa may have been responsible for the increase in high dust concentrations observed in Barbados.
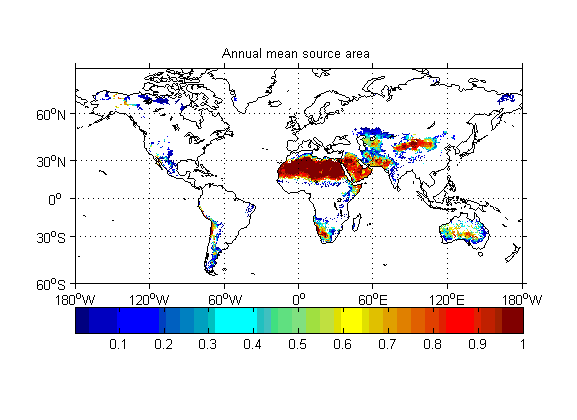
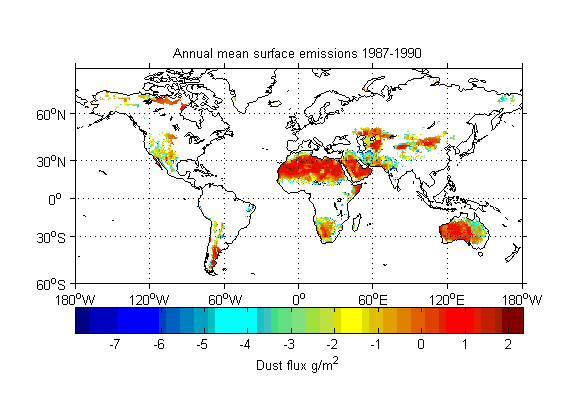
To model the dust cycle model, I coupled offline the Lund-Potsdam-Jena dynamic global vegetation (LPJ-DGVM) model to a dust emissions model and the TOMCAT atmospheric transport model. I used the LPJ-DGVM to calculate time evolving dust source areas. Surface emissions were calculated by simulating the processes of saltation and sandblasting. Dust was transported in the atmosphere by advection, convection, and diffusion. I removed dust from the atmosphere by adding a dry deposition and sub-cloud scavenging scheme to TOMCAT.


