glacier-fed rivers
river flow in glacier and snow-fed catchments
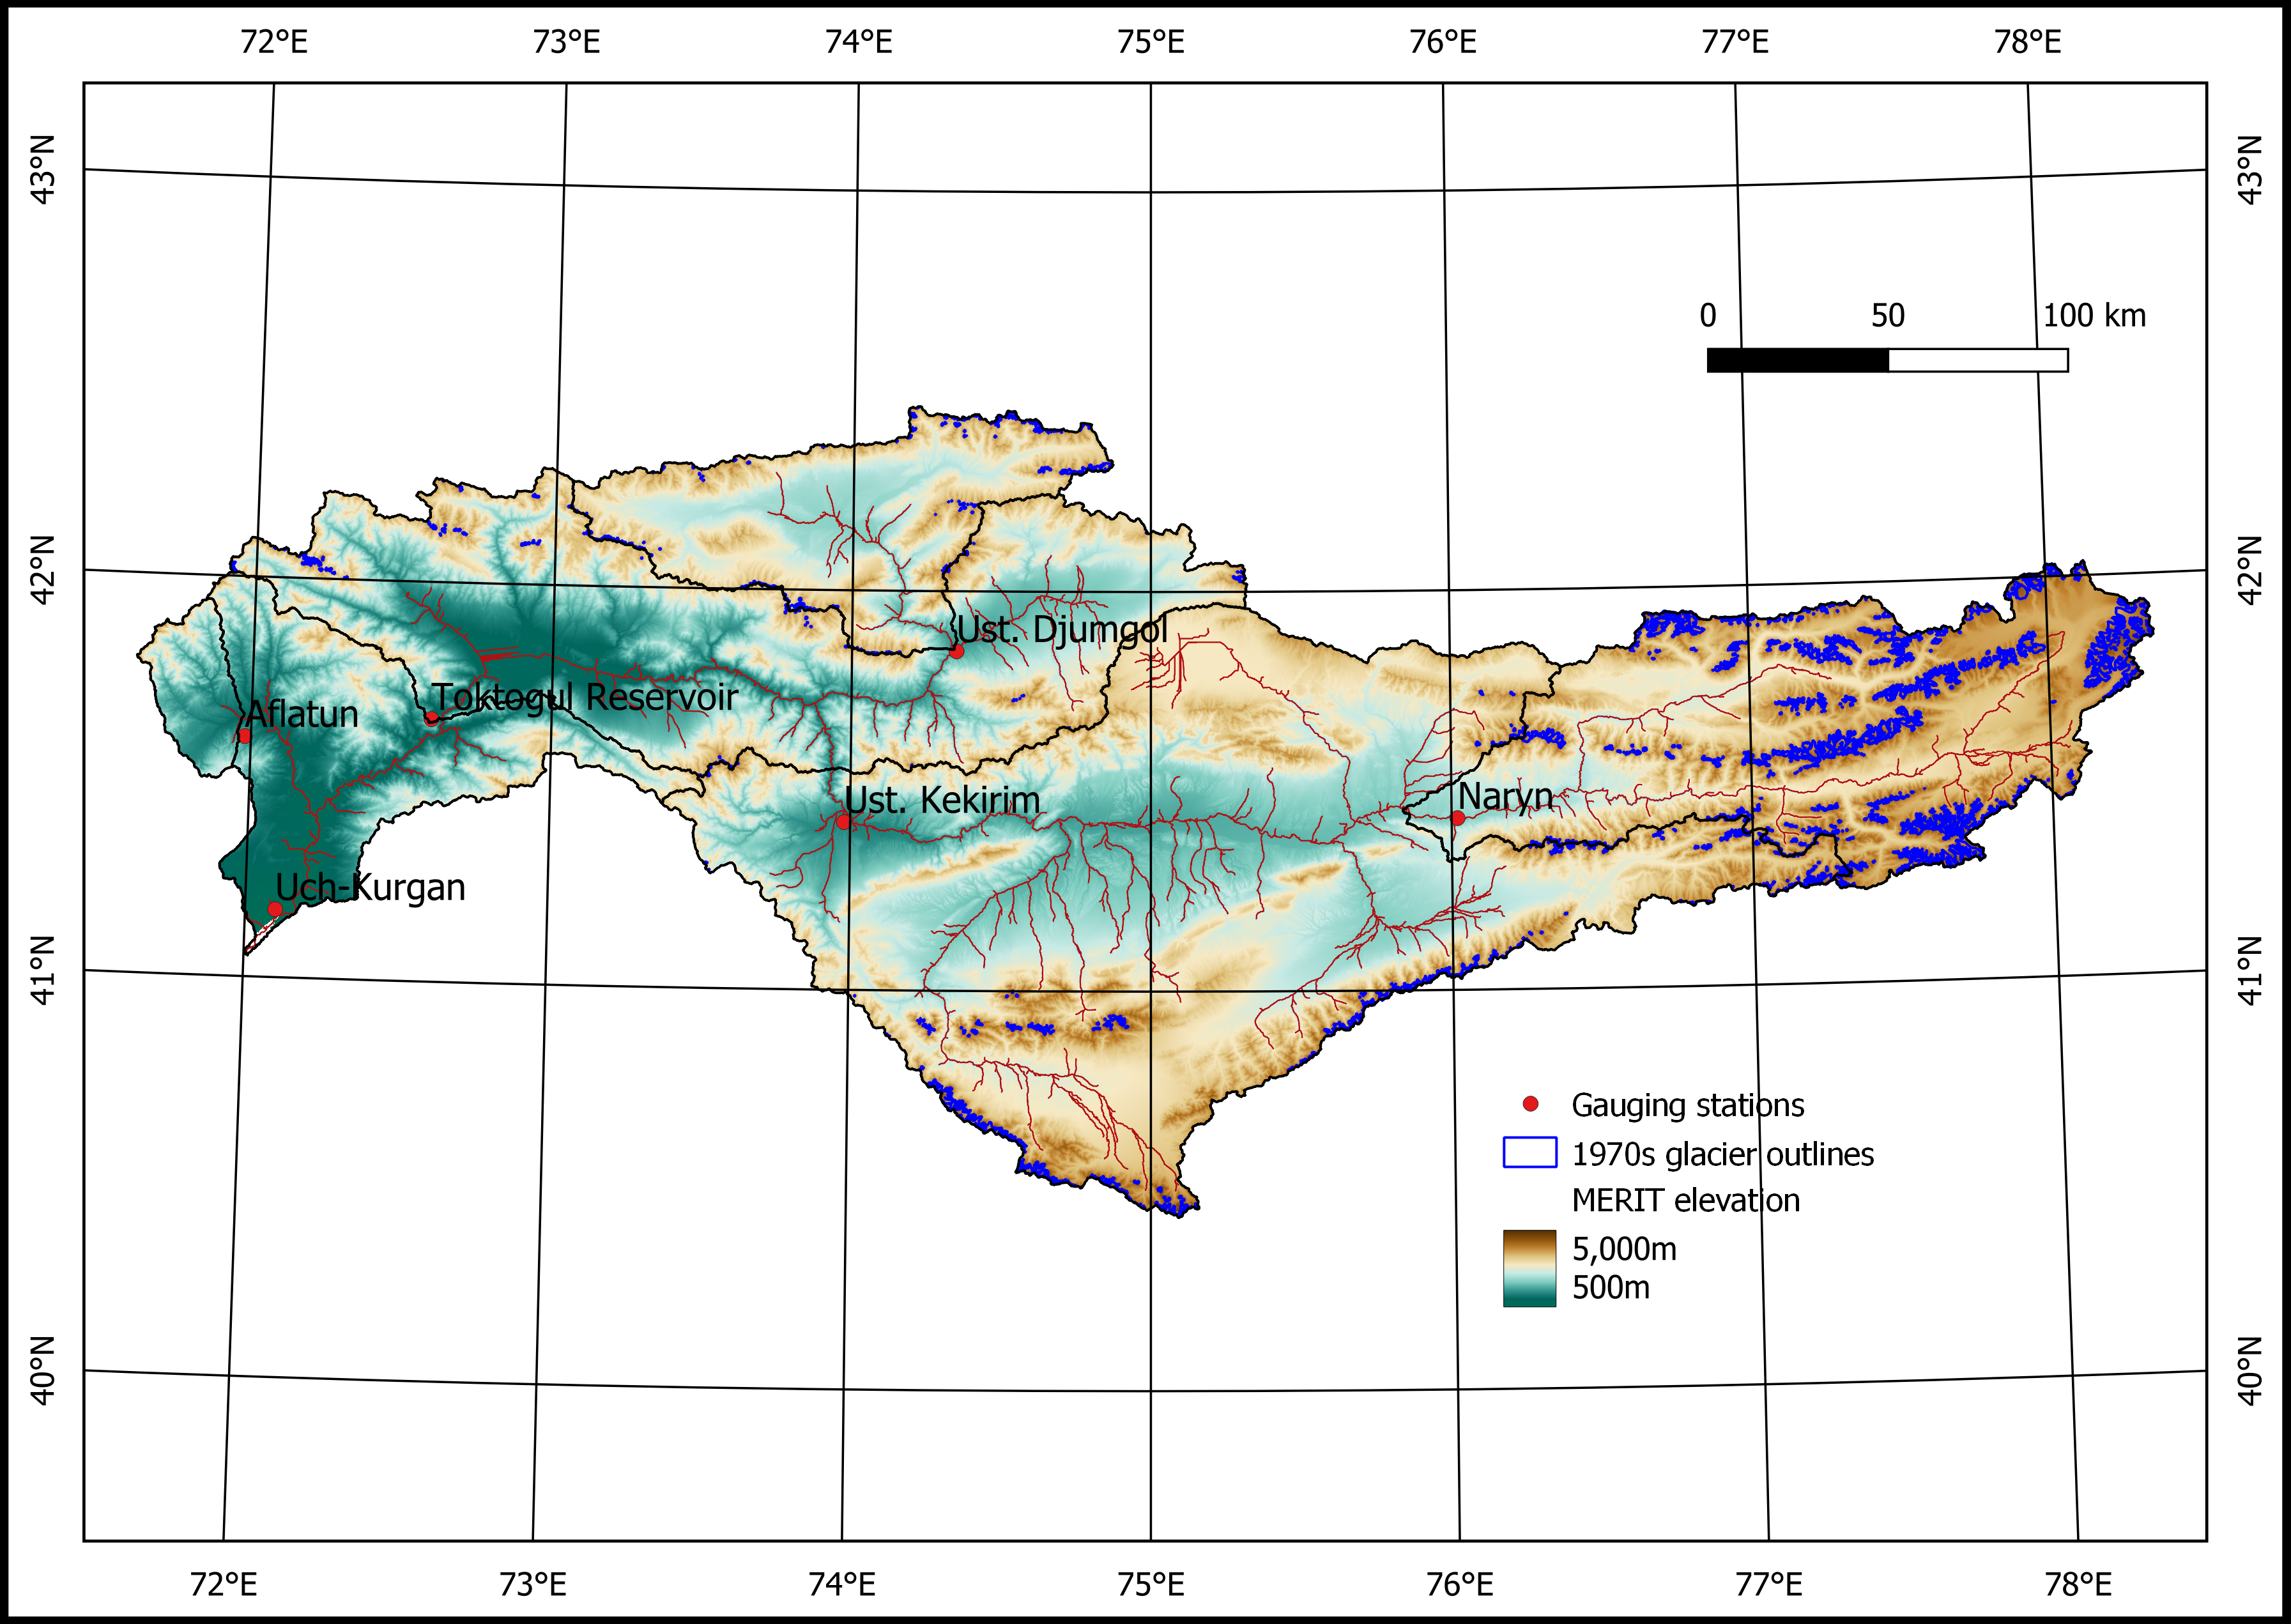
I have been working on a project on glacier melting and water security in Central Asia funded by the Leverhulme Trust. The aim of the project is to predict how glacier melting will impact water supply in the Syr Darya River in Central Asia. To investigate this, I implemented a degree day snow and glacier melt model into the Dynamic fluxEs and ConnectIvity for Predictions of HydRology (DECIPHeR) model. I used the model to generate projections of future river flow in the highly glacierised Naryn catchment in Kyrgyzstan, which is a tributary of the Syr Darya River.

Bias correction of regional climate modelling projections
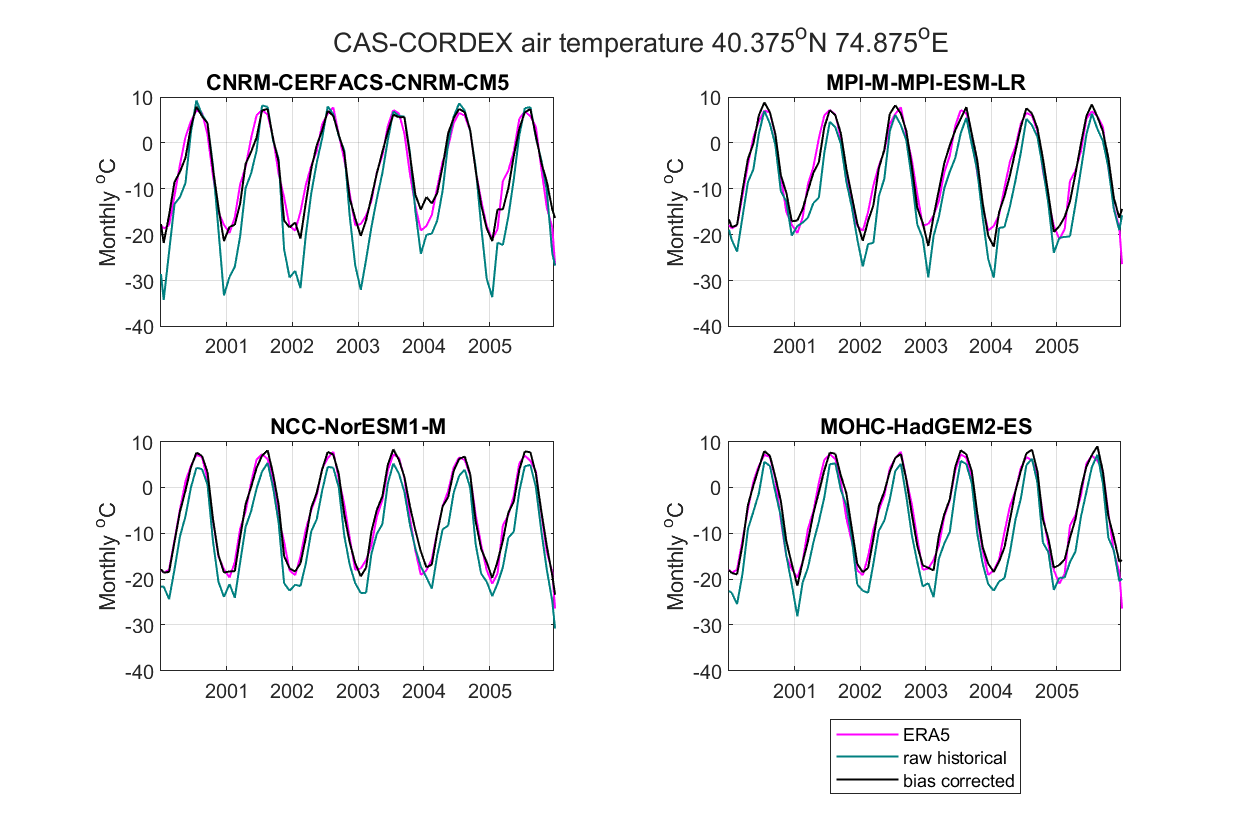
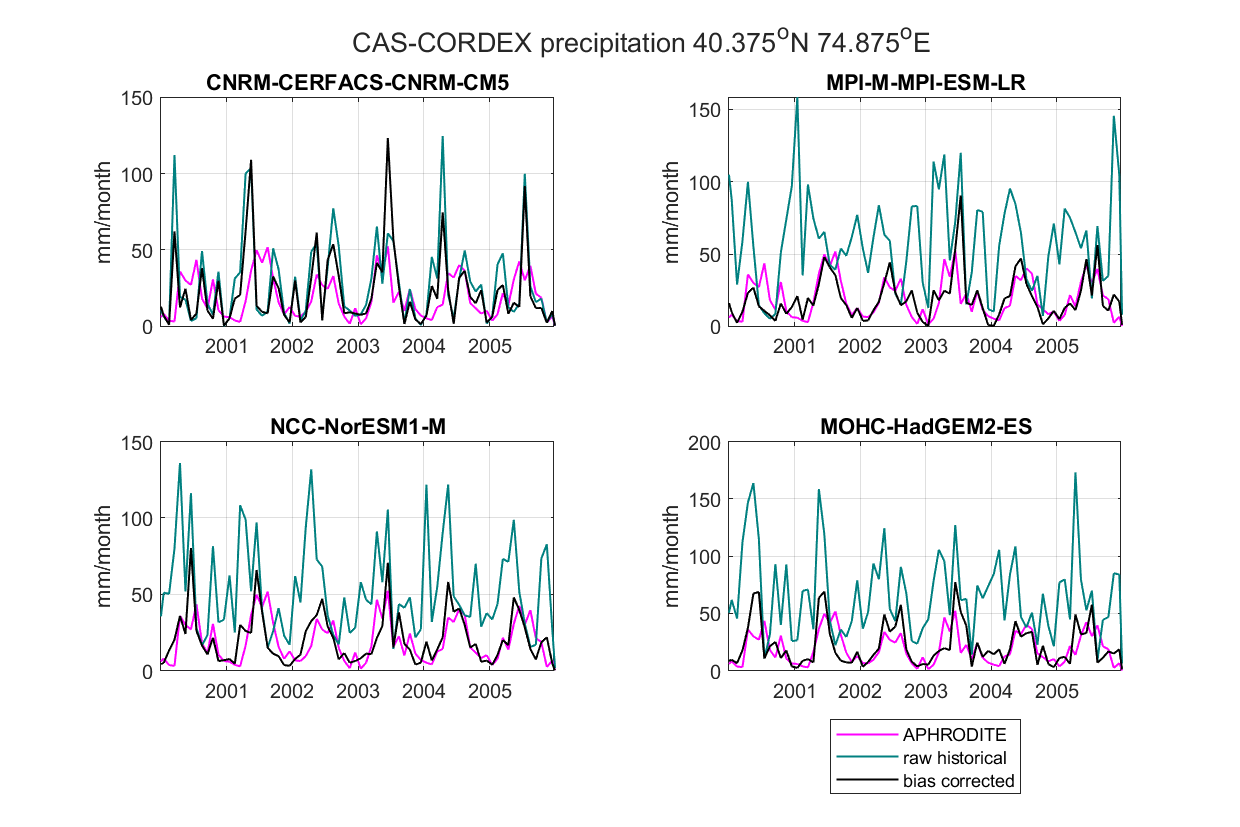
The model was forced with an ensemble of high-resolution regional climate modelling projections for Central Asia (CAS-CORDEX). Regional climate modelling data typically contains biases that need to be corrected before the data can be used to run hydrological models. I use the ‘quantile mapping’ approach to correct cold biases in the winter temperature. The method also corrects the overestimate and seasonal errors in the precipitation.
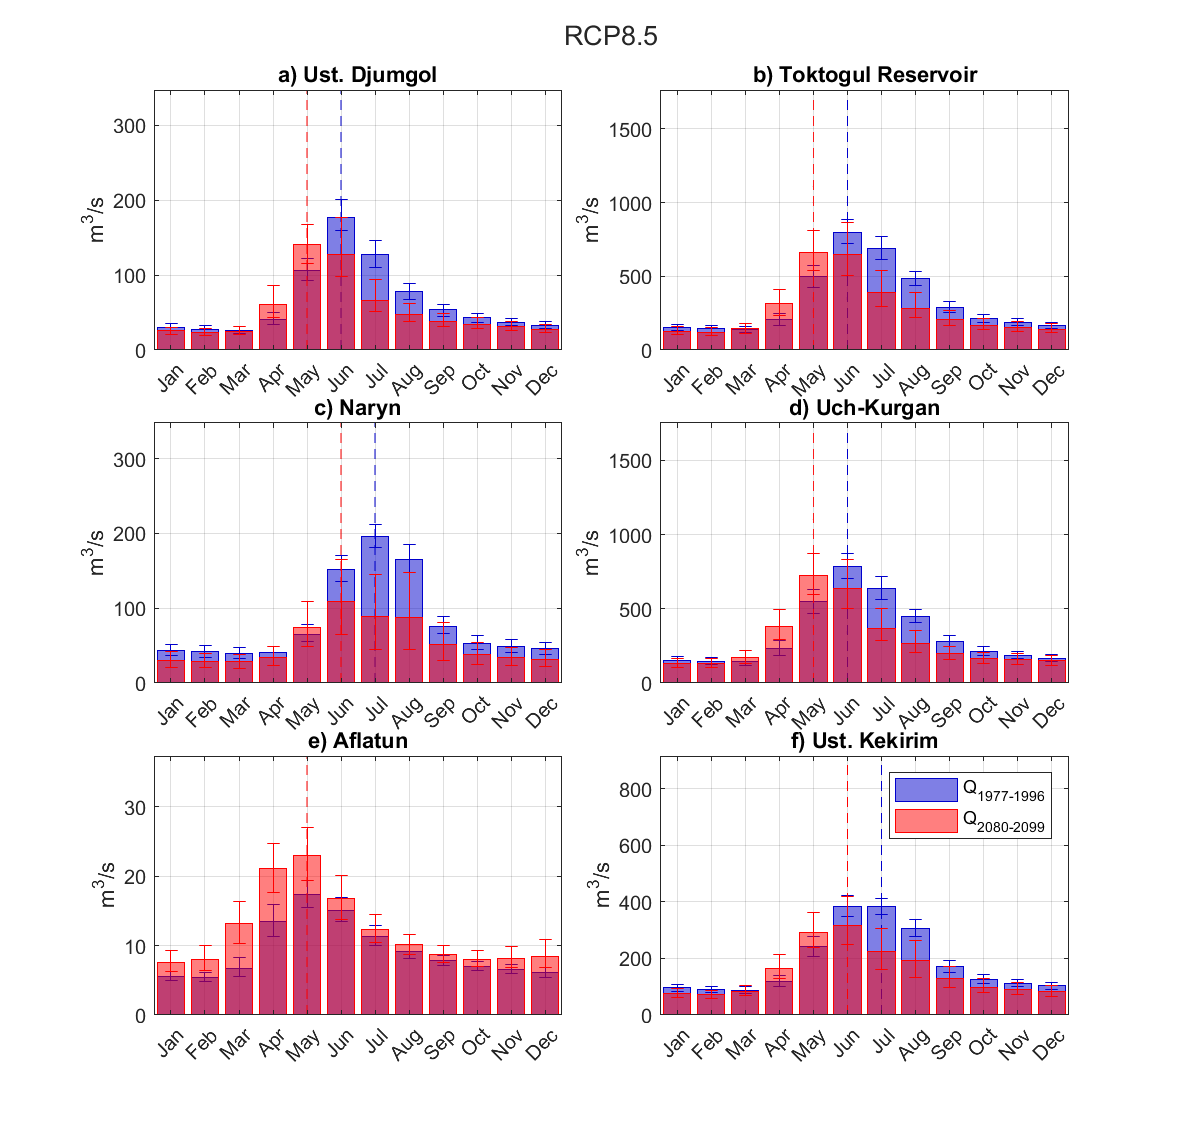
Future changes in seasonal streamflow in the Naryn river
Projections show that peak discharge shifts from summer to spring by the end of the century (2080-2099) relative to the historical period (1977-1996) for RCP8.5. This is caused by a reduction in the glacier melt input and an earlier snow melt season in spring caused by warming temperature of 3.7 deg C/decade over the catchment.
Glacier area projections for different climate change scenarios
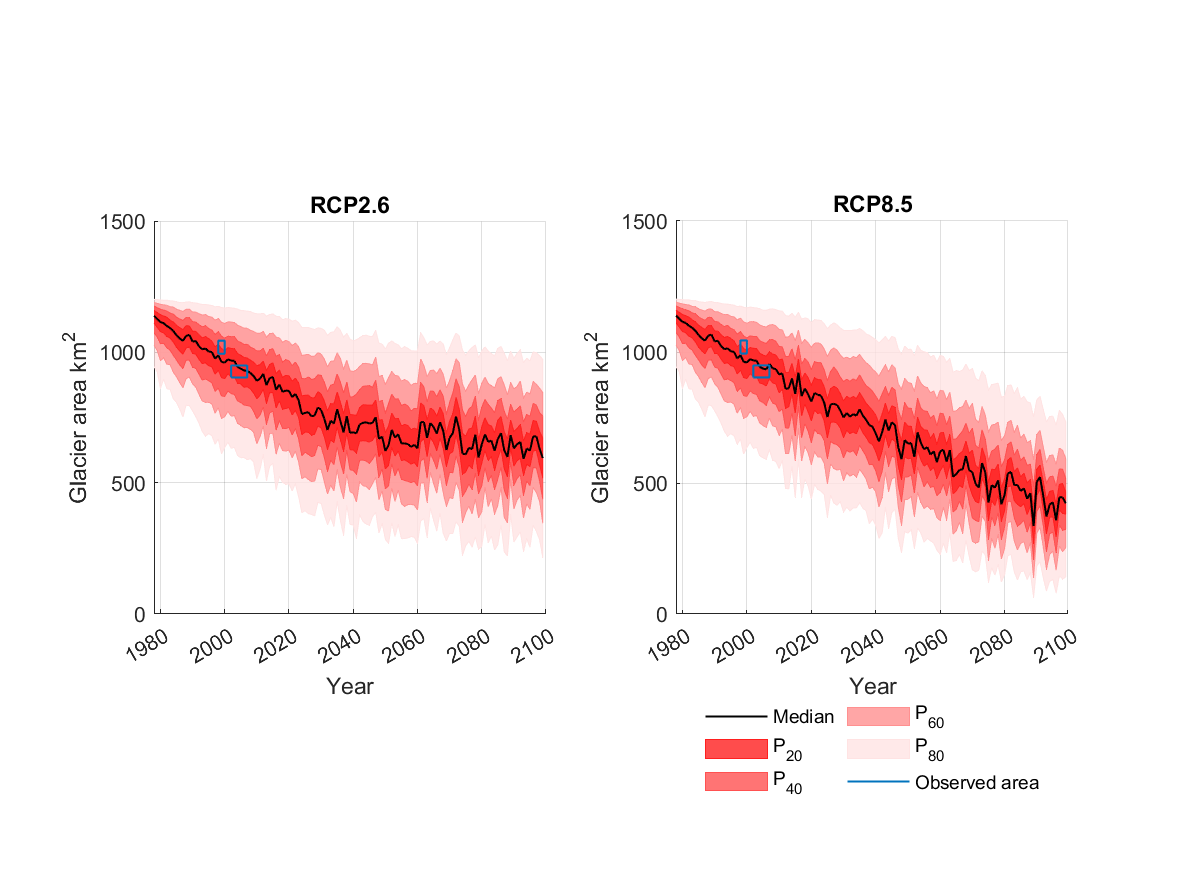
Under the RCP2.6 climate scenario the mean glaciated area reduces from 1,210km2 in 1977 to 600km2 by approximately 2040 and stabilises at this value until the end of the century. For the RCP8.5 climate scenario the glaciated area continues to decrease throughout the century, reaching 422km2 in 2099.
